
Jul 18, 2023
What are some of India TV's funny news stories?
When you see AQI, the Air Quality Index that rates how clean or polluted the air is based on concentrations of harmful particles and gases, also known as air quality index, you’re looking at a single number that hides a lot of science. The index pulls data from PM2.5, fine particulate matter smaller than 2.5 micrometers that can slip deep into the lungs and even enter the bloodstream, as well as PM10, NO₂, SO₂, CO and O₃. Each pollutant gets its own sub‑index, and the highest of those sub‑indices becomes the overall AQI value that ranges from 0 (excellent) to 500 (hazardous). India’s Central Pollution Control Board runs a nationwide network of air monitoring stations, fixed sensors placed in urban, suburban and rural zones that continuously record pollutant concentrations, temperature, humidity and wind speed. Those stations feed real‑time data to mobile apps, TV tickers and government dashboards, so anyone can check the current AQI for their city with a tap. When the AQI tip‑over reaches predefined thresholds, the government rolls out mitigation measures, actions like restricting diesel vehicles, ordering temporary shutdowns of high‑emission factories, issuing public health advisories and increasing green‑belt coverage. In short, AQI connects raw environmental data, public communication and policy response into a single, easy‑to‑understand score.
The moment the AQI climbs into the “unhealthy” or “very unhealthy” band, health effects start to show up. Health impacts, short‑term symptoms like coughing, throat irritation, eye redness and reduced lung function, plus long‑term risks such as asthma aggravation, cardiovascular disease and premature mortality become evident, especially for children, the elderly and people with pre‑existing conditions. A 2023 Indian Council of Medical Research (ICMR) analysis linked days with AQI above 200 to a 28 % rise in emergency room visits for respiratory issues and a 12 % increase in cardiovascular admissions. That data drives the government’s decision to send SMS alerts, display colour‑coded AQI levels on highways, and advise schools to keep children indoors during peak pollution hours. Economic loss is another side of the coin—productivity drops, healthcare costs surge, and tourism suffers in heavily polluted zones. Policymakers therefore use long‑term AQI trends to tighten emission standards for power plants, promote cleaner fuels like CNG and electric vehicles, and incentivise renewable energy projects. Cities such as Delhi have experimented with odd‑even vehicle schemes, while Mumbai’s coastal monitoring stations have helped the municipal corporation time the opening of new bus lanes to periods of better air quality. All these steps illustrate how the AQI serves as a bridge between scientific measurement, public health guidance, and regulatory action.
Beyond government plans, citizens are getting more involved. Community‑run low‑cost sensors, often built with Arduino or Raspberry Pi kits, feed additional data into open‑source platforms, filling gaps where official stations are sparse. Mobile apps let users log symptoms and see how their personal experience matches the AQI, creating a feedback loop that can influence future mitigation policies. Looking ahead, machine‑learning models are being trained on years of AQI data to predict pollution spikes a few days in advance, giving authorities even more time to act. The articles below showcase AQI’s ripple effect across different parts of Indian life—whether it’s a cricket match postponed due to smog, an exam centre closed because of unsafe air, a housing project that markets “green” building standards, or a political debate about stricter emission rules. Browse the collection to see concrete examples of how a simple index shapes sport, education, real‑estate, and policy across the country.
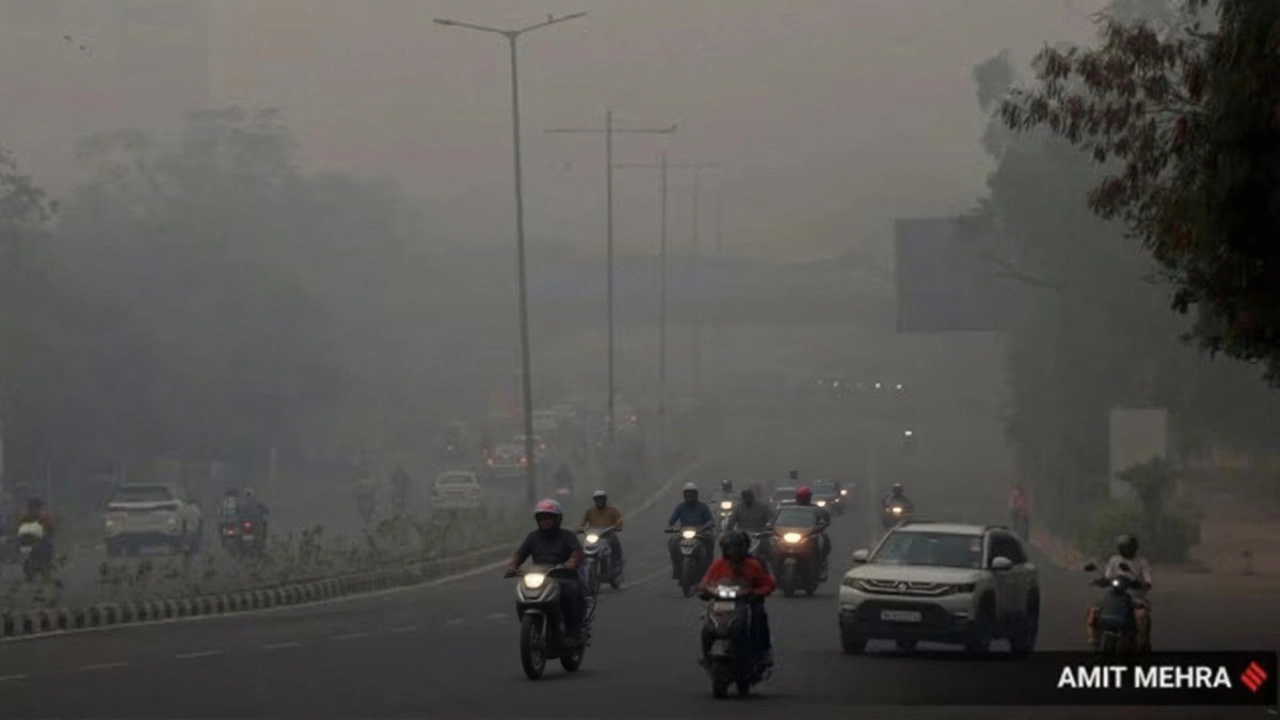
Delhi's AQI tops 400 on Nov 28, 2024 as crop burning, stagnant winds and traffic haze trigger Stage IV restrictions and a spike in respiratory cases.